The following are the most important global and US real estate statistics for those researching the markets or industry.
Key Statistics
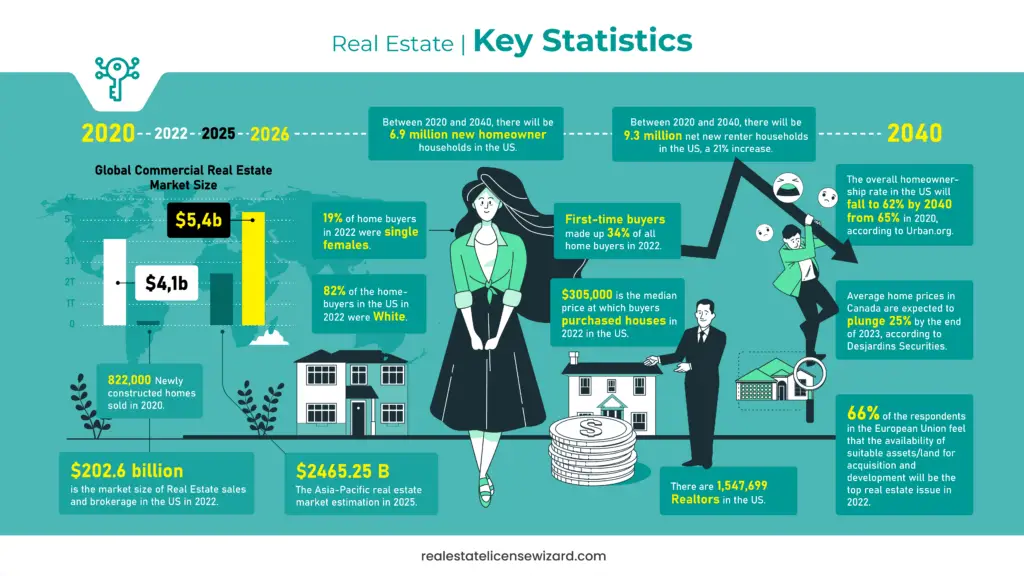
- The global real estate market is expected to reach $5388.87 billion in 2026 at a CAGR of 9.6%. (1)
- 822,000 newly constructed homes were sold in 2020, according to the U.S. Census Bureau. (4)
- The overall homeownership rate in the US will fall to 62% by 2040 from 65% in 2020, according to Urban.org. (11)
- Between 2020 and 2040, there will be 6.9 million new homeowner households in the US. (11)
- Between 2020 and 2040, there will be 9.3 million net new renter households in the US, a 21% increase. (11)
- 82% of the homebuyers in the US in 2022 were White. (12)
- First-time buyers made up 34% of all home buyers in 2022, according to the National Association of Realtors. (12)
- 19% of home buyers in 2022 were single females, according to the National Association of Realtors. (12)
- $305,000 is the median price at which buyers purchased houses in 2022 in the US. (12)
- 66% of the respondents in the European Union feel that the availability of suitable assets/land for acquisition and development will be the top real estate issue in 2022. (14)
- The Asia-Pacific real estate market was estimated to be valued at $2465.25 Billion in 2025. (18)
- Average home prices in Canada are expected to plunge 25% by the end of 2023, according to Desjardins Securities. (66)
- $202.6 billion is the market size of Real Estate sales and brokerage in the US in 2022. (29)
- There are 1,547,699 Realtors in the US, according to a 2022 NAR report. (31)
- $4.1 trillion was the Global Commercial Real Estate Market Size in 2022. (53)
The real estate sector is critical to a nation’s economy. Some common real estate forms are residential, commercial, land, and industrial.
Like other industries, the global real estate sector also had to bear the brunt of the pandemic. The commercial sector was badly impacted, especially the ones dealing with office and retail space, was badly impacted. The residential space sector wasn’t immune to the pandemic either. It saw the prospective homeowners look for options beyond the main city center to escape the pandemic and reap the benefits of remote working. As a result, there was an increased sale of the previously owned home in the US. There was also a rush for larger houses where people wanted to accommodate an office space.
As the economy has started opening up, real estate has also begun seeing signs of growth. However, many components in the landscape have changed permanently. The real estate industry is also on the verge of seeing major changes due to various technological disruptions. Advancements like artificial intelligence (AI) and the Internet of Things (IoT) will boost the real estate market growth in the future.
In this article, I have compiled critical real estate statistics that will help you to understand the trends in this industry.
Real Estate Industry Trends
- The global real estate market is expected to reach $5388.87 billion in 2026 at a CAGR of 9.6%. (1)
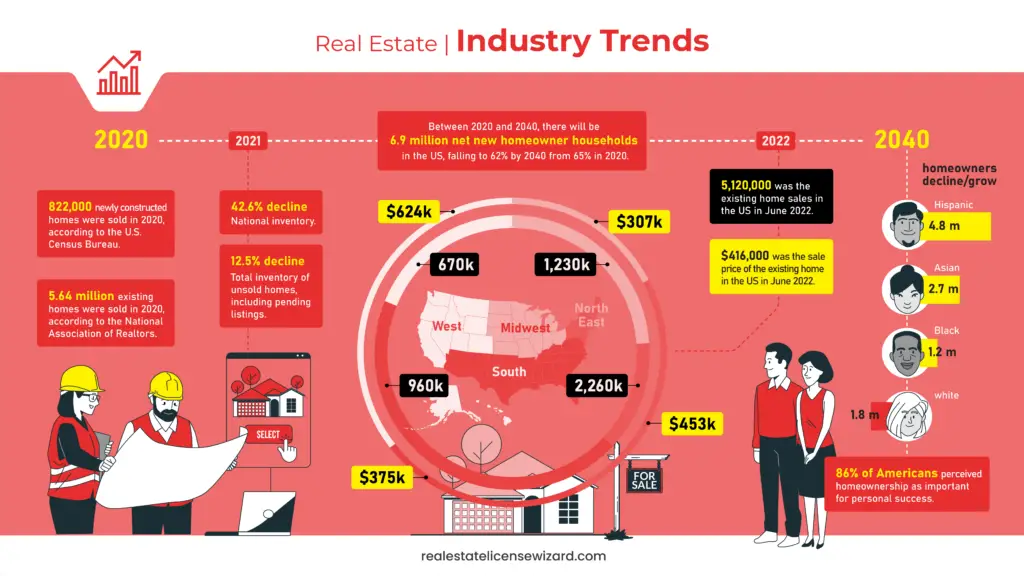
- 18.9% was the y-o-y decline in the national inventory of active property listings in March 2022. (2)
- 12.5% was the decline in the total inventory of unsold homes, including pending listings over last year. (2)
- $405,000 is the national median listing price for active listings in March 2022, up 13.5% compared to last year and up 26.5% compared to March 2020. (2)
- 21.5% is the year-over-year nominal house price appreciation in November, the sixth consecutive month it has set a new record. (2)
- 5.64 million existing homes were sold in 2020, according to the National Association of Realtors. (3)
- 822,000 newly constructed homes were sold in 2020, according to the U.S. Census Bureau. (4)
- 15.4% was the median national home listing price increase over last year, averaging $346,000 in January 2021. (5)
- In the United States, residential real-estate prices were up 17% between March 2020 and March 2021, according to the National Association of Realtors. (6)
- The nation’s median listing price per square foot grew by 17.5% in January 2021 compared to last year. (7)
- San Diego experienced a 13.2% increase in home values from 2019–2020. (8)
- National inventory in the US declined by 42.6% leading to 443,000 fewer homes for sale in January 2021 compared to January 2020. (7)
- 86% of Americans perceived homeownership as important for personal success. (9)
- 5,120,000 was existing home sales in the US in June 2022. (10)
- 670,000 was the existing home sales in the Northeast US in June 2022. (10)
- 1,230,000 was the existing home sales in the Midwest US in June 2022. (10)
- 2,260,000 was the existing home sales in the South US in June 2022. (10)
- 960,000 was the existing home sales in the West US in June 2022. (10)
- $416,000 was the sale price of the average existing home in the US in June 2022. (10)
- $453,300 was the sale price of the average existing home in the Northeastern US in June 2022. (10)
- $306,900 was the sale price of the average existing home price in the Midwestern US in June 2022. (10)
- $374,900 was the sale price of the average existing home in the Southern US in June 2022. (10)
- $624,000 was the sale price of the average existing home in the Western US in June 2022. (10)
- The overall homeownership rate in the US will fall to 62% by 2040 from 65% in 2020, according to Urban.org. (11)
- Elderly African American renters will more than double to 2.6 million in 2040 from 1.3 million in 2020. (11)
- Between 2020 and 2040, there will be 6.9 million net new homeowner households in the US. (11)
- According to Urban.org, Hispanic homeowners will grow by 4.8 million in 2040. (11)
- According to Urban.org, homeowners of other races (mostly Asian homeowners) will grow by 2.7 million, and African American homeowners will grow by 1.2 million in 2040. (11)
- According to Urban.org, the total number of white homeowners will decline by 1.8 million in 2040. (11)
- Between 2020 and 2040, there will be 9.3 million net new renter households in the US, a 21% increase. (11)
Real Estate Demographics
Demographics describe the composition of a population, such as age, ethnicity, gender, income, population growth, and migration patterns. Demographics is a critical factor that determines real estate pricing and market demand. Major demographic transformation in a nation can lead to deep changes in the real estate landscape for several years to come.
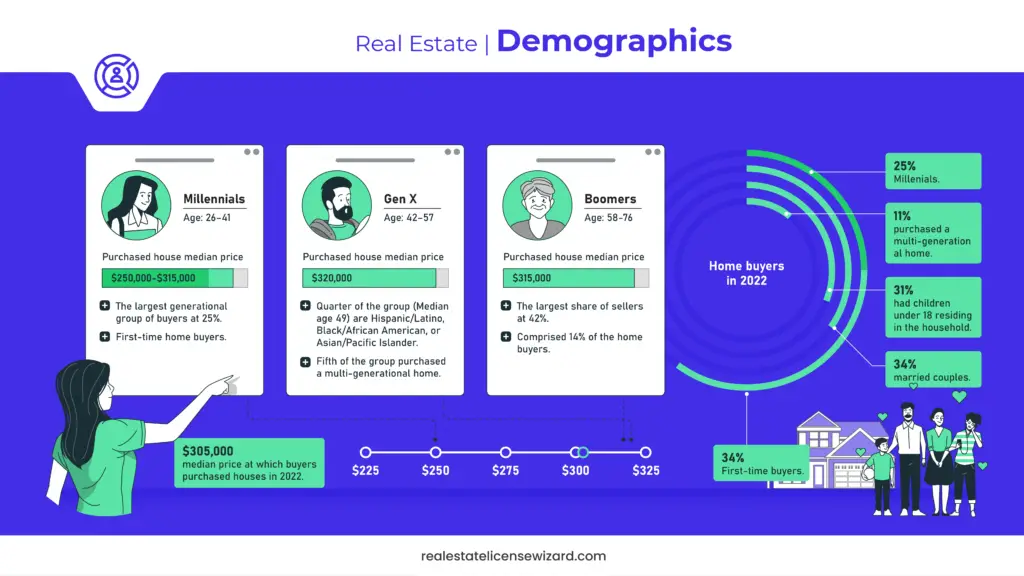
- First-time buyers made up 34% of all home buyers in 2022, according to the National Association of Realtors. (12)
- 81% of Younger Millennials and 48% of Older Millennials were first-time home buyers, according to the National Association of Realtors. (12)
- 56 to 65 (Younger Baby Boomers) comprised 14% of the home buyers, according to the National Association of Realtors. (12)
- With 25%, Older Millennials (median age 36) made up the largest generational group of buyers, according to the National Association of Realtors. (12)
- Buyers 75 to 95 (The Silent Generation) represented the smallest share of buyers at 4%, according to the National Association of Realtors. (12)
- Baby Boomers make up the largest share of sellers at 42%, according to the National Association of Realtors. (12)
- 60% of home buyers in 2022 were married couples, according to the National Association of Realtors. (12)
- 19% of home buyers in 2022 were single females, according to the National Association of Realtors. (12)
- 9% of the home buyers in 2022 were single males, and 9% were unmarried couples. (12)
- 11% of home buyers purchased a multi-generational home to care for and spend time with aging parents. (12)
- 15% of Gen X home buyers (Median age 49) purchased a multi-generational home, according to the National Association of Realtors. (12)
- 23% of Gen X home buyers (Median age 49) are Hispanic / Latino, Black / African American, or Asian / Pacific Islander. (12)
- 31% of all buyers had children under 18 residing in the household, according to the National Association of Realtors. (12)
- $305,000 is the median price at which buyers purchased houses in 2022. (12)
- Buyers in the age group of 23-31 purchased houses at the median price of $250,000 in 2022, according to the National Association of Realtors. (12)
- Buyers in the age group of 32-41 purchased houses at the median price of $315,000 in 2022, according to the National Association of Realtors. (12)
- Buyers in the age group of 42-56 purchased houses at the median price of $320,000 in 2022. (12)
- Buyers in the age group of 57-66 purchased houses at the median price of $315,000 in 2022. (12)
- Buyers in the age group of 67-75 purchased houses at the median rate of $295,000 in 2022. (12)
- Buyers in the age group of 76-96 purchased houses at the median rate of $296,000 in 2022. (12)
- In the US, 75.3% of people aged 55 to 64 are homeowners. (13)
- In the US, 79.4% of people aged 65 and above are homeowners. (13)
Europe Real Estate Statistics
Europe Residential Real Estate Market features Condominiums and Apartments, Villas, and Landed Houses. The European property market sailed through during the pandemic, led by a prolonged period of ultra-low interest rates and rising demand for larger houses, as many spent more time at home.
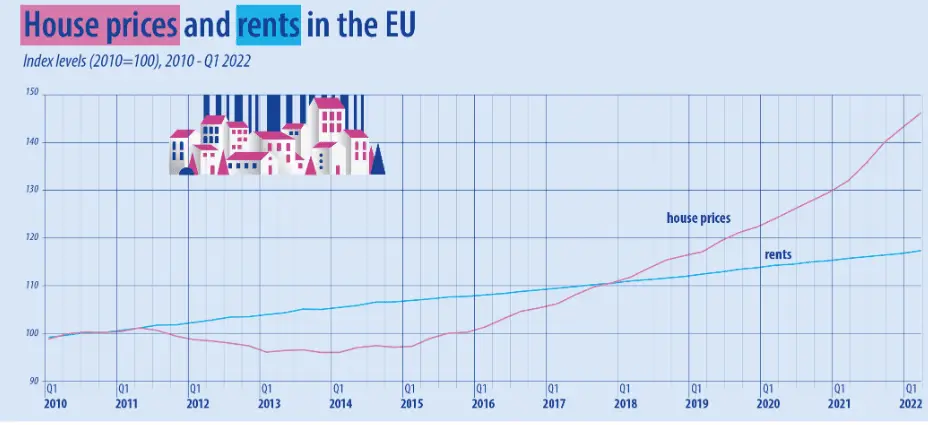
- The cost of buying a home has climbed by 45% since 2010, according to research by the European Commission. (67)
- Rent in the European nation increased by far lower than 17%, according to research by the European Commission. (67)
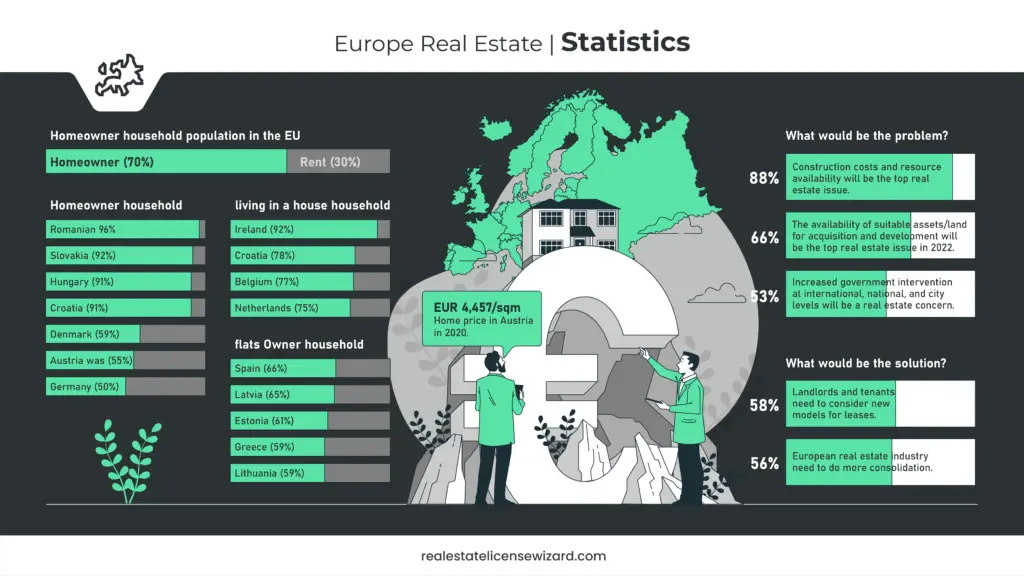
- 88% of the respondents in the European Union feel that Construction costs and resource availability will be the top real estate issue in 2022. (14)
- 66% of the respondents in the European Union feel that the availability of suitable assets/land for acquisition and development will be the top real estate issue in 2022. (14)
- 53% of the respondents in the European Union feel that increased government intervention at international, national, and city levels will be a real estate concern. (14)
- 58% of the respondents agree that Landlords and tenants will consider new models for leases. (14)
- 56% feel that there will be more consolidation in the European real estate industry. (14)
- 70% of the population in the EU lived in a household owning their home, while the remaining 30% lived in rented housing in 2020. (15)
- 96% of the Romanian population lived in a household that owned their home, followed by Slovakia (92%), Hungary, and Croatia (both 91%). (15)
- The shares of homeownership in Austria were 55%, and Denmark at 59%. (15)
- Ireland (92 %) recorded the highest share of the population living in a house, followed by Croatia (78%), Belgium (77%), and the Netherlands (75%). (15)
- The highest homeownership shares for flats were observed in Spain (66%), Latvia (65%), Estonia (61%), Greece, and Lithuania (59%). (15)
- At 50.4%, Germany has the lowest percentage of homeowners in Europe. (16)
- At 55.3%, Austria has the second-lowest homeownership rate in Europe. (16)
- The home price in Austria was EUR 4,457/sqm in 2020. (17)
- The home price in France was EUR 4,421/sqm in 2020. (17)
- The average home price in Germany, the United Kingdom, and Israel was EUR 4,000/sqm. (17)
Asia Pacific Real Estate Statistics
The pandemic has reinstated the appeal of property as a critical diversification and wealth protection means for Asian buyers. Experts predict significant growth in Asia-Pacific’s most expensive housing markets. They also expect a buoyant demand for property in the coming months as economies slowly begin to be back on track.
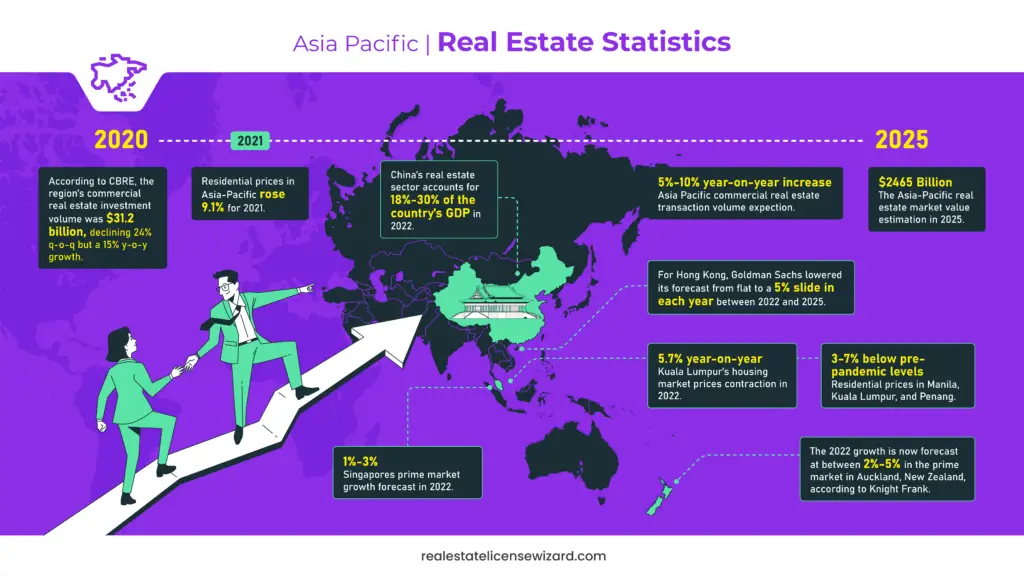
- The Asia-Pacific real estate market was estimated to be valued at $2465.25 Billion in 2025. (18)
- Residential prices in Asia-Pacific rose 9.1% for 2021. (65)
- China’s real estate sector accounts for 18%-30% of the country’s GDP in 2022. (19)
- There will be a 5% – 10% year-on-year increase in Asia Pacific commercial real estate transaction volume, expects CBRE. (20)
- According to CBRE, the region’s commercial real estate investment volume was $ 31.2 billion, declining 24% q-o-q but a 15% y-o-y growth. (21)
- For Hong Kong, Goldman Sachs lowered its forecast from flat to a 5% slide each year between 2022 and 2025. (65)
- The 2022 growth is now forecast at between 2%-5% in the prime market in Auckland, New Zealand, according to Knight Frank. (22)
- The 2022 growth is now forecast at between 1%-3% in the prime market in Singapore, according to Knight Frank. (22)
- Prices contracted 5.7% Yo-Y for Kuala Lumpur’s housing market in 2022, according to Knight Frank. (22)
- Residential prices in Manila, Kuala Lumpur, and Penang are 3-7% below pre-pandemic levels, according to Knight Frank. (23)
Canada Real Estate Statistics
A massive boom during the pandemic drove Canadian home values to record levels. However, the scenario changed after the Bank of Canada started raising interest rates in March to prevent an overheated economy. As a result, there has been a sharp decline in sentiment and prices in Toronto and the areas around it. There are also indications that the weakness is spreading across the other parts of the country too.
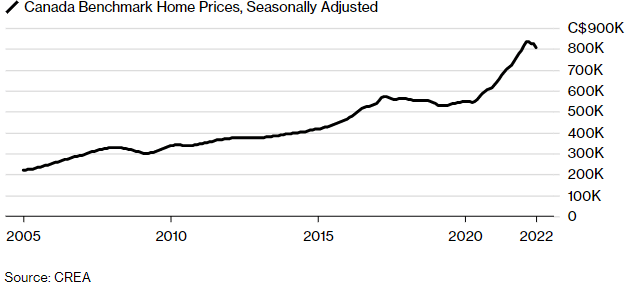
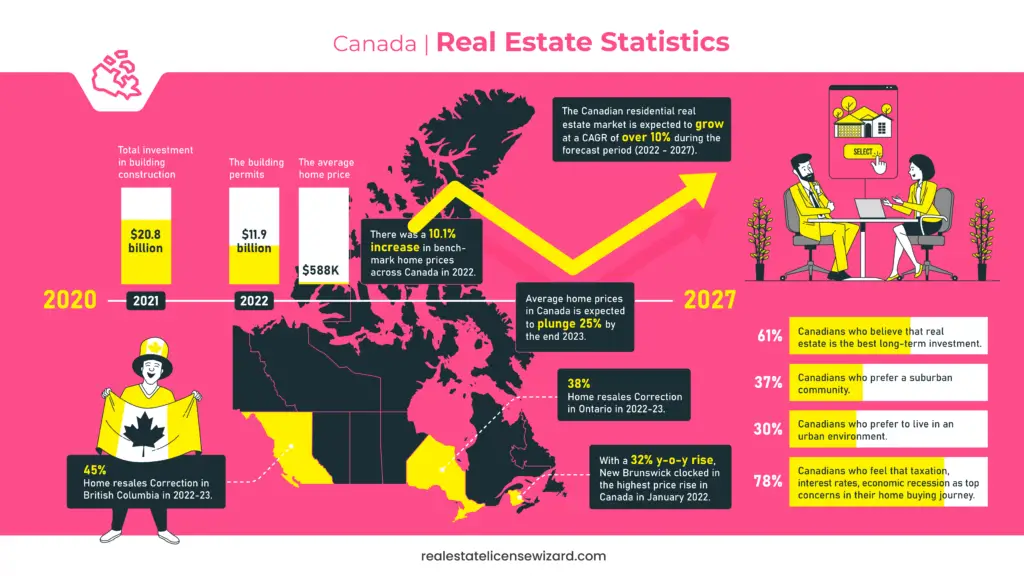
- Average home prices in Canada are expected to plunge 25% by the end of 2023, according to Desjardins Securities. (66)
- The Canadian residential real estate market is expected to grow at a CAGR of over 10% during the forecast period (2022 – 2027). (24)
- Canadian home prices are expected to drop 19% by 2023, according to TD. (25)
- The average home price in Canada in January 2022 was $587,487. (24)
- With a 32% y-o-y rise, New Brunswick clocked in the highest price rise in Canada in January 2022. (24)
- $20.8 billion was the total investment in building construction in Canada for 2021. (26)
- Building permits in June 2022 were $11.9 billion. (26)
- There was a 10.1% increase in benchmark home prices across Canada in 2022. (27)
- There is expected to be a 7.3% drop in benchmark real estate prices in Canada in 2023. (27)
- There will be a 45% correction in the home resales in British Columbia and a 38%. (27) correction in Ontario in 2022-23, according to the Royal Bank of Canada.
- 61% of Canadians believe that real estate is the best long-term investment, according to a survey. (28)
- 37% of Canadians prefer a suburban community, while 30% want to live in an urban environment. (28)
- 78% of Canadians feel that taxation, interest rates, and economic recession are the top concerns in their home-buying journey. (28)
US Real Estate Agent Statistics
Any house purchase or renting activity is incomplete without a real estate agent, broker, or Realtor. All three real estate professionals are distinct from one another. Real estate agents possess a professional license to help people buy, sell, and rent real estate. Brokers are those who have added training and licensing requirements. On the other hand, a Realtor is a licensed real estate agent or broker who is also a member of the National Association of Realtors (NAR).
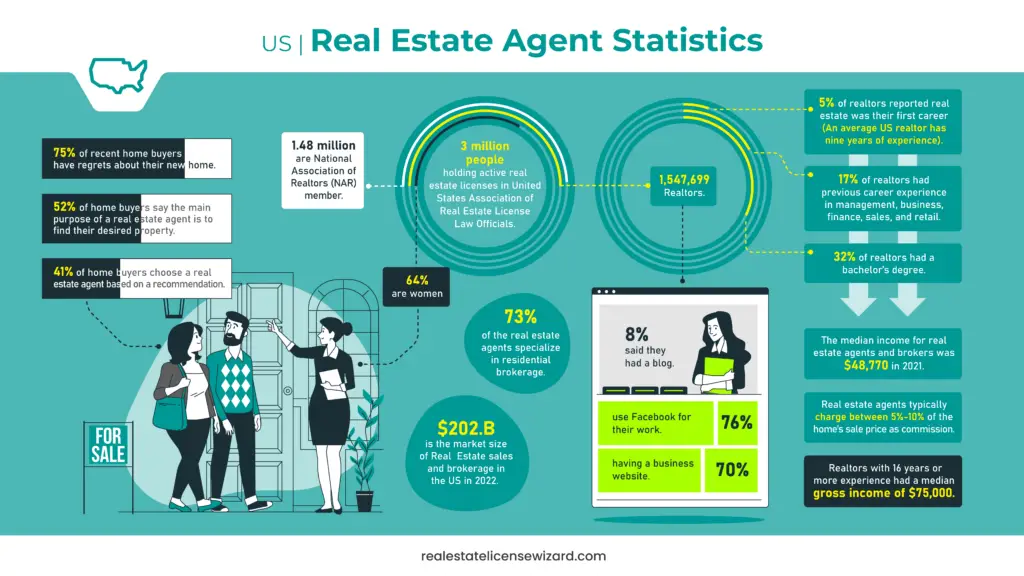
- $202.6 billion is the market size of Real Estate sales and brokerage in the US in 2022. (29)
- There are more than 3 million people holding active real estate licenses in the United States Association of Real Estate License Law Officials (ARELLO). (30)
- There are 1,547,699 Realtors in the US, according to a 2022 NAR report. (31)
- Florida has 213,759 registered Realtors in 2022. (31)
- California has 205,248 registered Realtors in 2022. (31)
- 41% of home buyers choose a real estate agent based on a recommendation. (32)
- 52% of home buyers say the main purpose of a real estate agent is to find their desired property. (32)
- 75% of recent home buyers have regrets about their new home. (33)
- 64% of realtors in the US are women. (34)
- 76% of realtors use Facebook for their work. (34)
- An average US realtor has nine years of experience. (35)
- 70% of realtors reported having a business website, while only 8% said they had a blog. (35)
- In California, the real estate industry experienced a 6% job loss from February to September 2020. (36)
- 17% of realtors had previous career experience in management, business, finance, sales, and retail. (35)
- In 2020, only 32% of realtors had a bachelor’s degree. (35)
- Only 5% of realtors in 2020 reported that real estate was their first career. (35)
- The median pay for real estate agents was $48,930 per year in 2019. (37)
- With an average of 2.53 employment per 1000 jobs, South Carolina, Oklahoma, and Washington have the highest concentration of real estate agent jobs in the US. (37)
- $110,113 is the average annual salary of real estate agents in Vermont. (38)
- $111,225 is the average annual salary of real estate agents in Massachusetts. (38)
- $102,469 is the average annual salary of real estate agents in Montana. (38)
- $111,641 is the average annual salary of real estate agents in New York. (38)
- $99,710 is the average annual salary of real estate agents in Michigan. (38)
- Real estate agents typically charge between 5%-10% of the home’s sale price as commission. (39)
- 5.5% was the average commission for real estate agents in 2021. (39)
- The median income for real estate agents and brokers was $48,770 in 2021, according to the US Bureau of Labor Statistics. (37)
- The median pay for real estate agents was $48,930 per year in 2019. (37)
- National Association of Realtors (NAR) membership grew to 1.48 million at the end of 2020, from 1.4 million at the end of 2019. (40)
- 68% of the realtors hold sales agent licenses in 2020. (40)
- 73% of the real estate agents specialize in residential brokerage. (40)
- The median gross income for Realtors was $43,330 in 2020. (40)
- Realtors with 16 years or more experience had a median gross income of $75,000. (40)
- One out of four Realtors earned $100,000 or more in 2020. (40)
- The average annual salary of a real estate agent in Illinois is $71,588 as of July 2022. (73)
US Housing Market Statistics
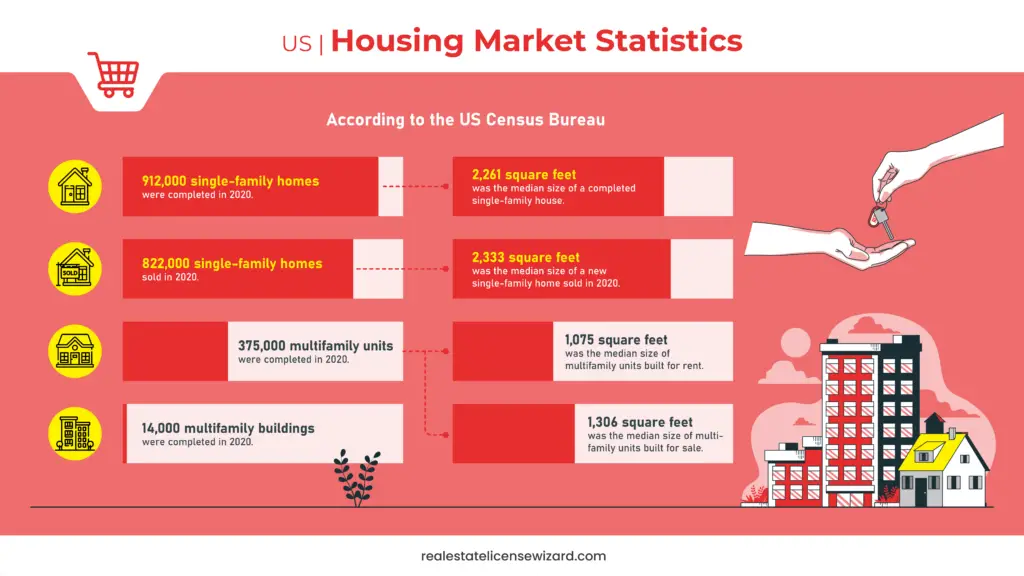
- 912,000 single-family homes were completed in 2020, according to the US Census Bureau, . (41)
- 2,261 square feet was the median size of a completed single-family house. (41)
- 375,000 multifamily units were completed in 2020, according to the US Census Bureau. (41)
- The median size of multifamily units built for rent was 1,075 square feet, while the median of those built for sale was 1,306 square feet. (41)
- 14,000 multifamily buildings were completed in 2020, according to the US Census Bureau. (41)
- 822,000 single-family homes were sold in 2020, according to the US Census Bureau. (41)
- 2,333 square feet was the median size of a new single-family home sold in 2020. (41)
- 123,000 contractor-built single-family homes were started in 2020. (42)
- Sales of new single‐family houses in June 2022 were at a seasonally adjusted annual rate of 590,000. (42)
US Real Estate Statistics
US Housing Statistics
- 5.6% is the national vacancy rate in the second quarter of 2022 for rental housing and 0.8% for homeowner housing, according to the United States Census bureau. (43)
- The rental vacancy rate was 6.2% in the second quarter of 2022. (43)
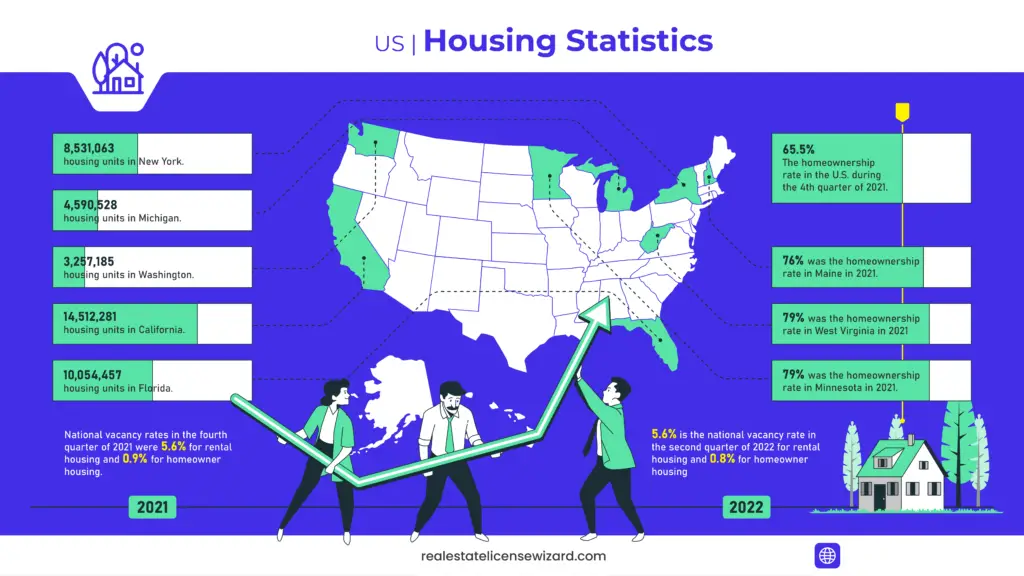
- National vacancy rates in the fourth quarter of 2021 were 5.6% for rental housing and 0.9% for homeowner housing. (44)
- The homeownership rate in the U.S. was 65.5% during the fourth quarter of 2021. (44)
- 79% was the homeownership rate in West Virginia in 2021. (44)
- 76% was the homeownership rate in Maine in 2021. (44)
- 79% was the homeownership rate in Minnesota in 2021. (44)
- According to the United States Census Bureau, California had 14,512,281 housing units as of June 2021, according to the United States Census bureau. (45)
- There are 10,054,457 housing units in Florida in June 2021, according to the United States Census bureau. (46)
- Michigan had 4,590,528 housing units as of June 2021, according to the United States Census bureau. (47)
- New York had 8,531,063 housing units as on June 2021, according to the United States Census bureau. (48)
- Washington had 3,257,185 housing units as on June 2021, according to the United States Census bureau. (49)
- New Jersey’s housing market was up by 10.3% in June 2022 compared to the previous year. (68)
- Homes in Louisiana are selling five days faster and $7,660 more than the yearly average. (69)
- Texas home values have risen by 22.1% compared to the previous year. (70)
- The median home value in Connecticut is $361,501, which shows that the value has increased by 12.4% compared to the previous year. (71)
- Homes in Illinois were sold quicker in June 2022 than in June 2021. (72)
Real Estate Homeownership per Ethnicity Statistics
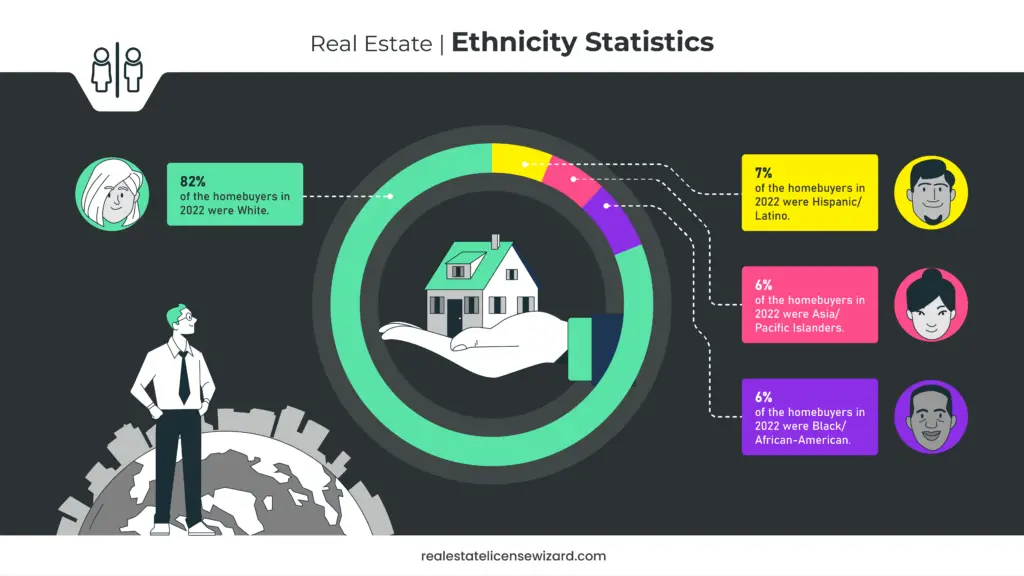
Homeownership in the US differs significantly by race and ethnicity. It is a major sign of individual wealth in America, and racial variations in homeownership have a role in ascertaining the distribution of wealth across demographic groups.
- 82% of the homebuyers in 2022 were White. (12)
- 7% of the homebuyers in 2022 were Hispanic/Latino.(12)
- 6% of the homebuyers in 2022 were Asia/ Pacific Islanders. (12)
- 6% of the homebuyers in 2022 were Black/African-American. (12)
US Mortgage Rate Statistics
Despite the labor market strength, there is economic uncertainty, and the economy is slowing due to inflation and ongoing geopolitical tensions. Inflationary pressures remain high, with the consumer price index (CPI) rising 8.5% year-over-year in May 2022. The Federal Reserve hiked the target fed funds rate by 1.5 percentage points through the first half of 2022, and the markets expect more rate increases.
- The Federal Reserve has increased the target fed funds rate by 1.5 percentage points through the first half of 2022. (50)
- Mortgage rates have increased to 5.3% in the second quarter of 2022 from 3.8% in the first quarter. (50)
- Freddie Mac forecasts 30-year fixed rates to average 5% in 2022 and rises to 5.1% in 2023. (50)
- Freddie Mac expects price growth to be 12.8% and 4.0% in 2022 and 2023, respectively. (50)
- Freddie Mac expects housing demand to slow to 6 million in 2022 and 5.4 million in 2023. (50)
- Freddie Mac expects home purchase mortgage originations to be $2.0 trillion in 2022, slowing to $1.9 trillion in 2023. (50)
- Freddie Mac expects forecast refinance activity to slow, with refinancing originations declining from $2.8 trillion in 2021 to $885 billion in 2022 and $463 billion in 2023. (50)
- Freddie Mac expects total originations to decline from the high of $4.8 trillion in 2021 to $2.8 trillion in 2022 and $2.3 trillion in 2023. (50)
- There are 46.1 million prospective first-time homeowners today, from 39.5 million in 2006. (50)
- According to Freddie Mac, 34% of buyers faced at least one mortgage denial before getting approved in 2021, from 22% in 2020. (50)
- 36- 12.8% is the annualized house price rise in 2022, as per Freddie Mac. (51)
- 37- 17.8% is the annualized house price rise in 2023, as per Freddie Mac. (51)
US Real Estate Pricing Statistics
- $440,300 was the median home price sold in the first quarter of 2022, according to Federal Reserve Economic Data. (54)
- The average sales price in the same period is higher, at $507,800. (54)
- $355852 was the median home price in the US in July 2022, according to the Zillow Home Value Index. (55)
- $848,926 is the median home price in Hawaii. (56)
- $760,800 is the median home price in California. (56)
- $701,895 is the median home price in the District of Columbia. (56)
- $595,732 is the median home price in Washington. (56)
- $559,312 is the median home price in Massachusetts. (56)
- $544,868 is the median home price in Utah. (56)
- $502,215 is the median home price in Oregon. (56)
- $466,435 is the median home price in Idaho. (56)
United States Home Size Statistics
American homes are usually quite large due to walk-in closets, laundry rooms, en suite bathrooms, and all the other amenities. The scenario varies across the states, though. In some congested urban areas, the average home size is shrinking, while new buildings in the South and West are massive constructions.
- 1,309 sq. ft. is the average home size in Hawaii. (57)
- 1,625 sq. ft. is the average home size in California. (57)
- 1,440 sq. ft. is the average home size in the District of Columbia. (57)
- 1,903 sq. ft. is the average home size in Washington. (57)
- 2,126 sq. ft. is the average home size in Colorado. (57)
- 1,744 sq. ft is the average home size in Massachusetts. (57)
- 2,305 sq. ft. is the average home size in Utah. (57)
- 1,932 sq. ft. is the average home size in Idaho. (57)
US Rental Market Statistics
Redfin deputy chief economist Taylor Marr says, “More people are opting to live alone, and rising mortgage-interest rates are forcing would-be homebuyers to keep renting”. Renting is getting more expensive, but as mortgage payments have surpassed rents in most cities, most Americans now prefer to rent a house.
- $2,002 was the median monthly rent in the US in May 2022. (58)
- $4,008 was the median monthly asking rent in Nassau County in New York in May 2022. (58)
- The median monthly asking rent in Boston was $3,907 in May 2022. (58)
- There was a 48% year-over-year surge in the asking rent in Austin, Texas, since the beginning of 2019. (58)
- The asking rent in May 2022 surged 30% over a year in Nashville, TN, Seattle, and Cincinnati. (58)
- The rent growth in Portland was 24% over the year in May 2022. (58)
- The rent declined 10% in Milwaukee and 3% in Kansas City, MO, and Minneapolis in May 2022.
- 18% of US renters ages 24 to 39 expect always to rent a house. (59)
- Nearly 2 million renters could afford to buy a house farther out because of reduced commute to work, says Zillow. (60)
- Vacation home sales climbed 50% in August 2020 compared to the same month in 2019. (61)
- At 49.5%, Ocean City, New Jersey, had the highest share of vacation homes in 2020. (61)
- At 36.8%, Barnstable Town, Massachusetts, had the highest share of vacation homes in 2020. (61)
US Residential Construction Statistics
Residential construction pertains to the building and sale of both individual and multi-family dwellings. Single-units manufactured housing, duplexes, quadplexes, apartment buildings and condominiums are some of these dwellings. Not just building but home renovation also forms a major part of residential construction.
- $932,911 was the total residential construction spending in the US in June 2022.(62)
- There were 1,674,000 privately-owned housing units authorized by building permits in July 2022. (63)
- There were 1,696,000 privately-owned housing units authorized by building permits in June 2022. (63)
- Single‐family authorizations in July 2022 were at 928,000. (63)
- Authorizations of units in buildings with five units or more were at a rate of 693,000 in July 2022. (63)
- Privately‐owned housing starts in July 2022 were 1,446,000. (63)
- Single‐family housing starts in July 2022 were at a rate of 916,000. (63)
- Privately‐owned housing completions in July 2022 were at a seasonally adjusted annual rate of 1,424,000. (63)
- Single‐family housing completions in July were at a rate of 1,009,000. (63)
- On average, over 80% of the total permanent site, residential structures belong to single-family construction. (64)
- On average, nearly 20% of the total permanent site residential structures belong to multi-family construction. (64)
Global Commercial Real Estate Statistics
The pandemic adversely impacted the commercial real estate sector, due to travel restrictions, social distancing, and remote working. Now that the global market is recovering, sales are reaching pre-pandemic levels in the real estate industry. Urbanization, digitalization, and rising foreign investments are the key factors in boosting the commercial real estate market.
- In 2021, office occupancy experienced robust growth of more than 80% in almost 390 metro cities worldwide. (52)
- 30 million square feet (MSF) of office space has been absorbed since the third quarter of 2021. (52)
- The APAC region contributes more than 50% of office construction in the global market in the second quarter of 2021. (52)
- $4.1 trillion was the Global Commercial Real Estate Market Size in 2022. (53)
- 5.8% of the Global Commercial Real Estate Market Size Growth in 2022. (53)